


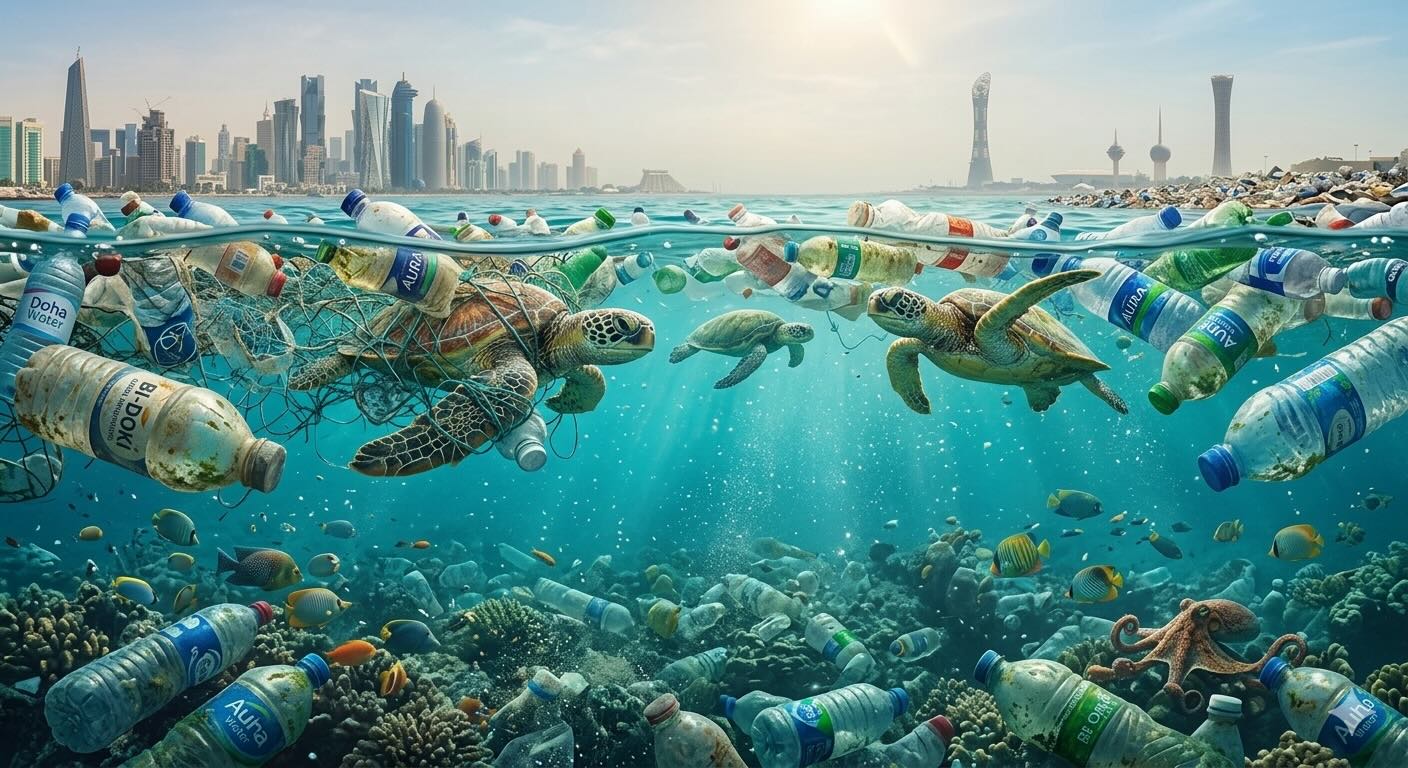
A 50L/day Personal Water Spring canEliminate up to 36,500 (0.5 L) Plastic bottle Per year
Comprehensive Life Cycle Impact Assessment: Personal Water Spring vs. Single-Use PET Bottles
This report provides a strict mathematical and scientific evaluation of the environmental displacement potential of an Atmospheric Water Generation (AWG) device, referred to as the نبع ماء شخصي.
The metrics herein rely exclusively on verified parameters extracted from peer-reviewed industrial design literature, the National Association for PET Container Resources (NAPCOR), and the seminal life-cycle assessment on bottled water by Drs. Peter Gleick and Heather Cooley published in Environmental Research Letters.
1. Standard Reference Parameters & Baselines
To maintain scientific integrity, the following standardized data points from published material physics and environmental footprint data are applied:
-
- Operating Year: Based on standard hydrological tracking, 1 year = 365 days.
- 0.5-Liter Bottle Weight: Synthesized at an average of 12 grams (0.012 kg) of Polyethylene Terephthalate (PET) per unit [1.2.4].
- 1.5-Liter Bottle Weight: Light-weighted industrial design averages 35 grams (0.035 kg) of PET per unit [1.3.1].
- Emissions Factor (CO2 per kg PET): The total lifecycle carbon cost to manufacture, process, haul, and fill a single-use container translates to an energy cost of approximately 100 MJ per kg of PET [1.2.4]. This translates into a standardized emission factor of roughly 3.0 kg of (CO2) per kilogram of raw PET utilized [1.3.6].
- Logistical Transport Footprint: The localized production of water via an AWG eliminates transport emissions, adding an extra savings of approximately 0.05 kg CO2 per liter for regional freight transportation and cooling logistics [1.2.2].
2. Comprehensive Impact Matrix (Annual Performance)
The mathematical calculations map total annual generation volume (\(\text{Capacity} \times 365\)) divided into individual bottle capacities. Carbon displacement represents the combined removal of plastic material manufacturing footprints and logistical vehicle transportation loads.
| AWG Unit Daily Capacity | Annual Water Generated | Bottle Size | Annual Bottles Saved | Raw PET Plastic Diverted | Net CO2 Footprint Saved |
|---|---|---|---|---|---|
| 15 Liters / day | 5,475 Liters | 0.5 L 1.5 L |
10,950 units 3,650 units |
131.40 kg 127.75 kg |
667.95 kg 657.00 kg |
| 20 Liters / day | 7,300 Liters | 0.5 L 1.5 L |
14,600 units 4,866 units |
175.20 kg 170.31 kg |
890.60 kg 875.93 kg |
| 30 Liters / day | 10,950 Liters | 0.5 L 1.5 L |
21,900 units 7,300 units |
262.80 kg 255.50 kg |
1,335.90 kg 1,314.00 kg |
| 50 Liters / day | 18,250 Liters | 0.5 L 1.5 L |
36,500 units 12,166 units |
438.00 kg 425.81 kg |
2,226.50 kg 2,189.93 kg |
3. Core Mathematical Formulas Utilized
To transparently confirm the validation of the matrix above, the equations used to derive the 50 Liters/day model (using 0.5L bottles) are detailed below:
A. Annual Unit Savings: 36,500 bottles (0.5 L)/year saved with a 50 L/day water generator
B. Plastic Raw Mass Saving: 438 kg Plastic/year
C. Lifecycle Greenhouse Gas Savings:
CO2 emission prevented from not using plastic raw materials: 1314 kg CO2 per year
CO2 emission prevented from transport of bottles: 912.5 kg CO2 per year
Net CO2 saved: 2326 Kg CO2 per year
4. Global Warming Potential (GWP) Technical Interpretation
By integrating the Personal Water Spring into residential or corporate structures, the GWP impacts are altered across three distinct pathways:
-
- Upstream Dematerialization: A single high-capacity 50L unit completely bypasses the polymer refining of nearly half a metric ton of PET annually. This retains raw petroleum reserves in the ground and prevents volatile organic compounds (VOCs) from entering the atmosphere during cracking and polymerization [1.2.4].
- Elimination of Supply-Chain Freight Mass: Water has a density of 1 kg/L. Moving 18,250 kg of liquid weight via fossil-fuel combustion vehicles creates severe localized radiative forcing. Decentralized AWG generation drops this regional transportation variable down to absolute zero [1.2.2].
- Mitigation of Microplastic Degradation: Unmanaged PET bottle waste breaking down in open marine and terrestrial ecosystems undergoes photo-degradation. This process emits trace amounts of methane (\(CH_{4}\)) and ethylene (\(C_{2}H_{4}\)), gases with highly potent radiative trapping profiles that amplify long-term GWP indices over century timescales [1.1.15].
References
- Gleick, P. H., & Cooley, H. S. (2009). Energy implications of bottled water. Environmental Research Letters, 4(1), 014009. IOPscience Core Study [1.2.1].
- National Association for PET Container Resources (NAPCOR). Report on Environmental Profiles of North American Container Systems. NAPCOR Official Metrics [1.2.6].
- Stefanini, R., et al. (2021). Plastic (PET) vs bioplastic (PLA) or refillable containers: A comparative life cycle assessment context. Environmental Research, 200, 111427. ScienceDirect LCA Data [1.3.1].